
Container details
Select a container to open its detail page. Four tabs cover everyday troubleshooting. Use the back arrow to return to the list.
Next to the title, the restart policy picker changes how the app restarts this container, with a one-line status beside it. See restart policies.
For a container in another WSLc session, the title shows Session: NAME instead; logs, shell and inspect work against that session, while the restart policy picker is hidden and the Telemetry tab explains that charts are available only for this app's session.
Logs
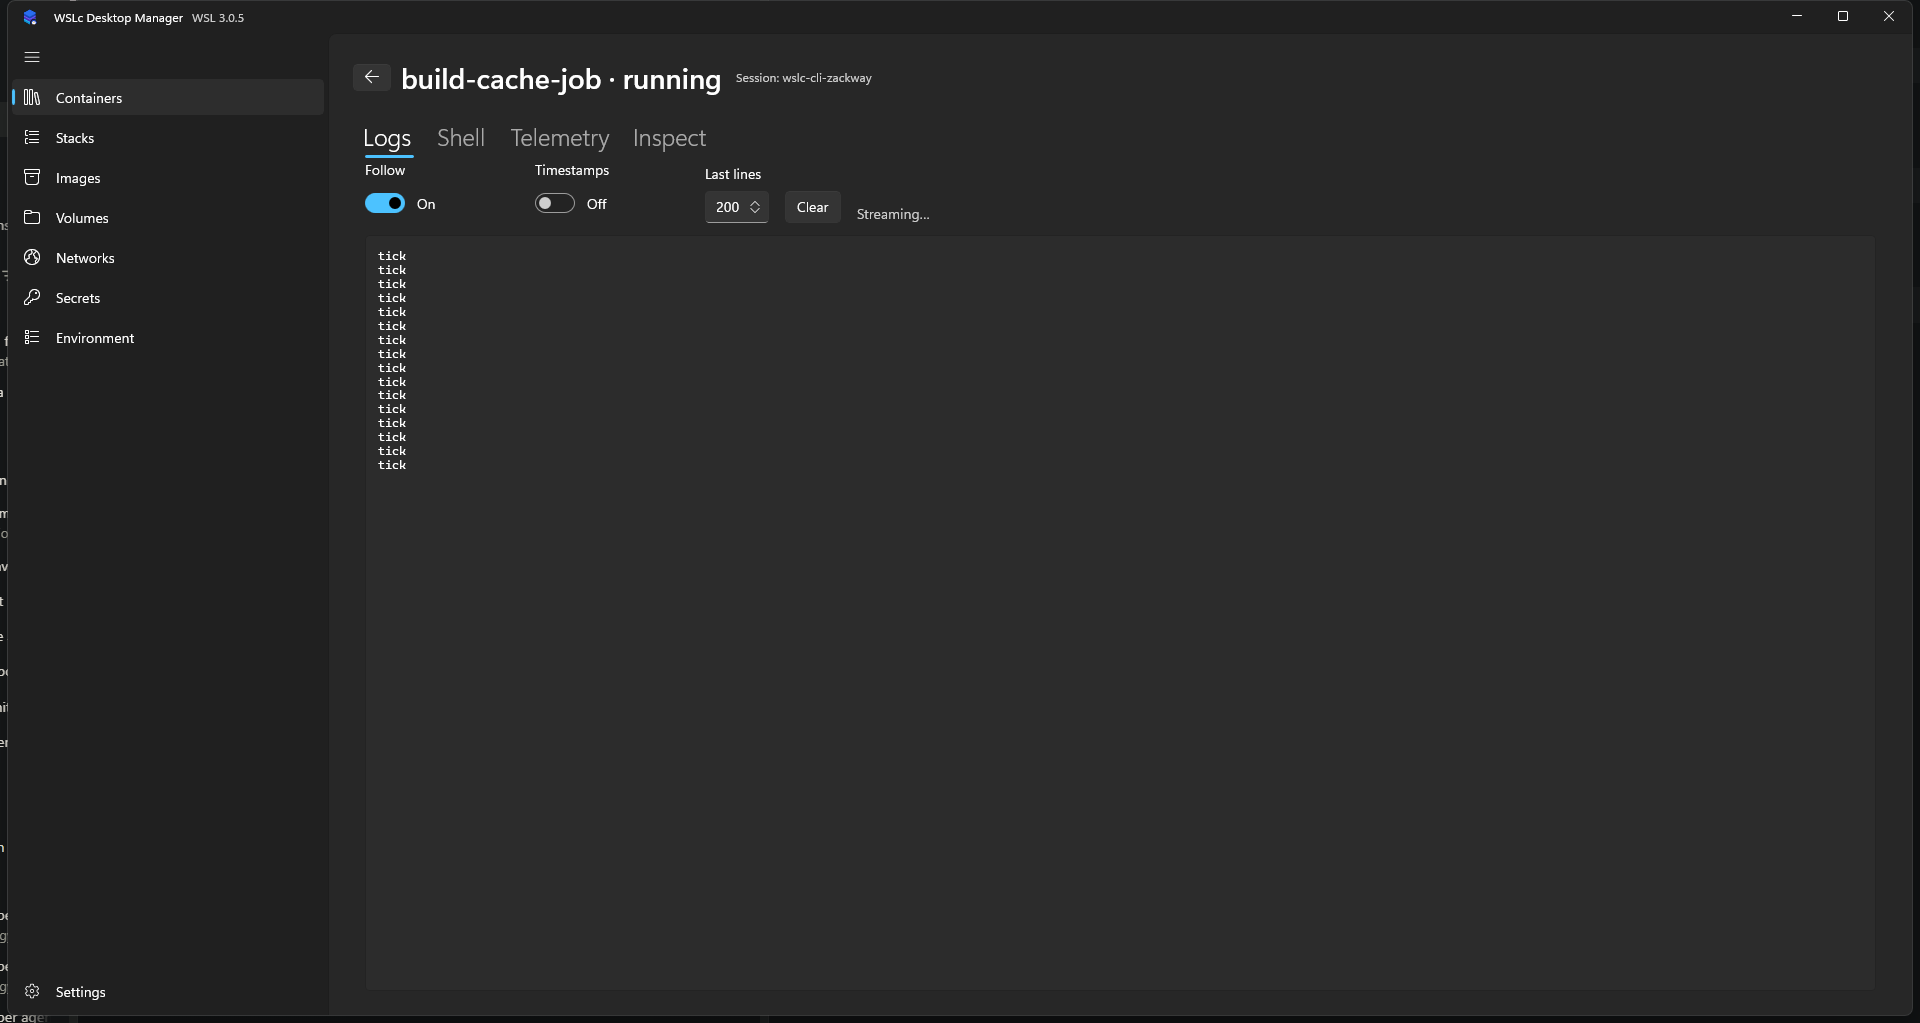
- Follow streams new output as it arrives.
- Timestamps prefixes each line with its time.
- Last lines sets how much history to load (default 200).
- Clear empties the view; it doesn't touch the container.
Shell
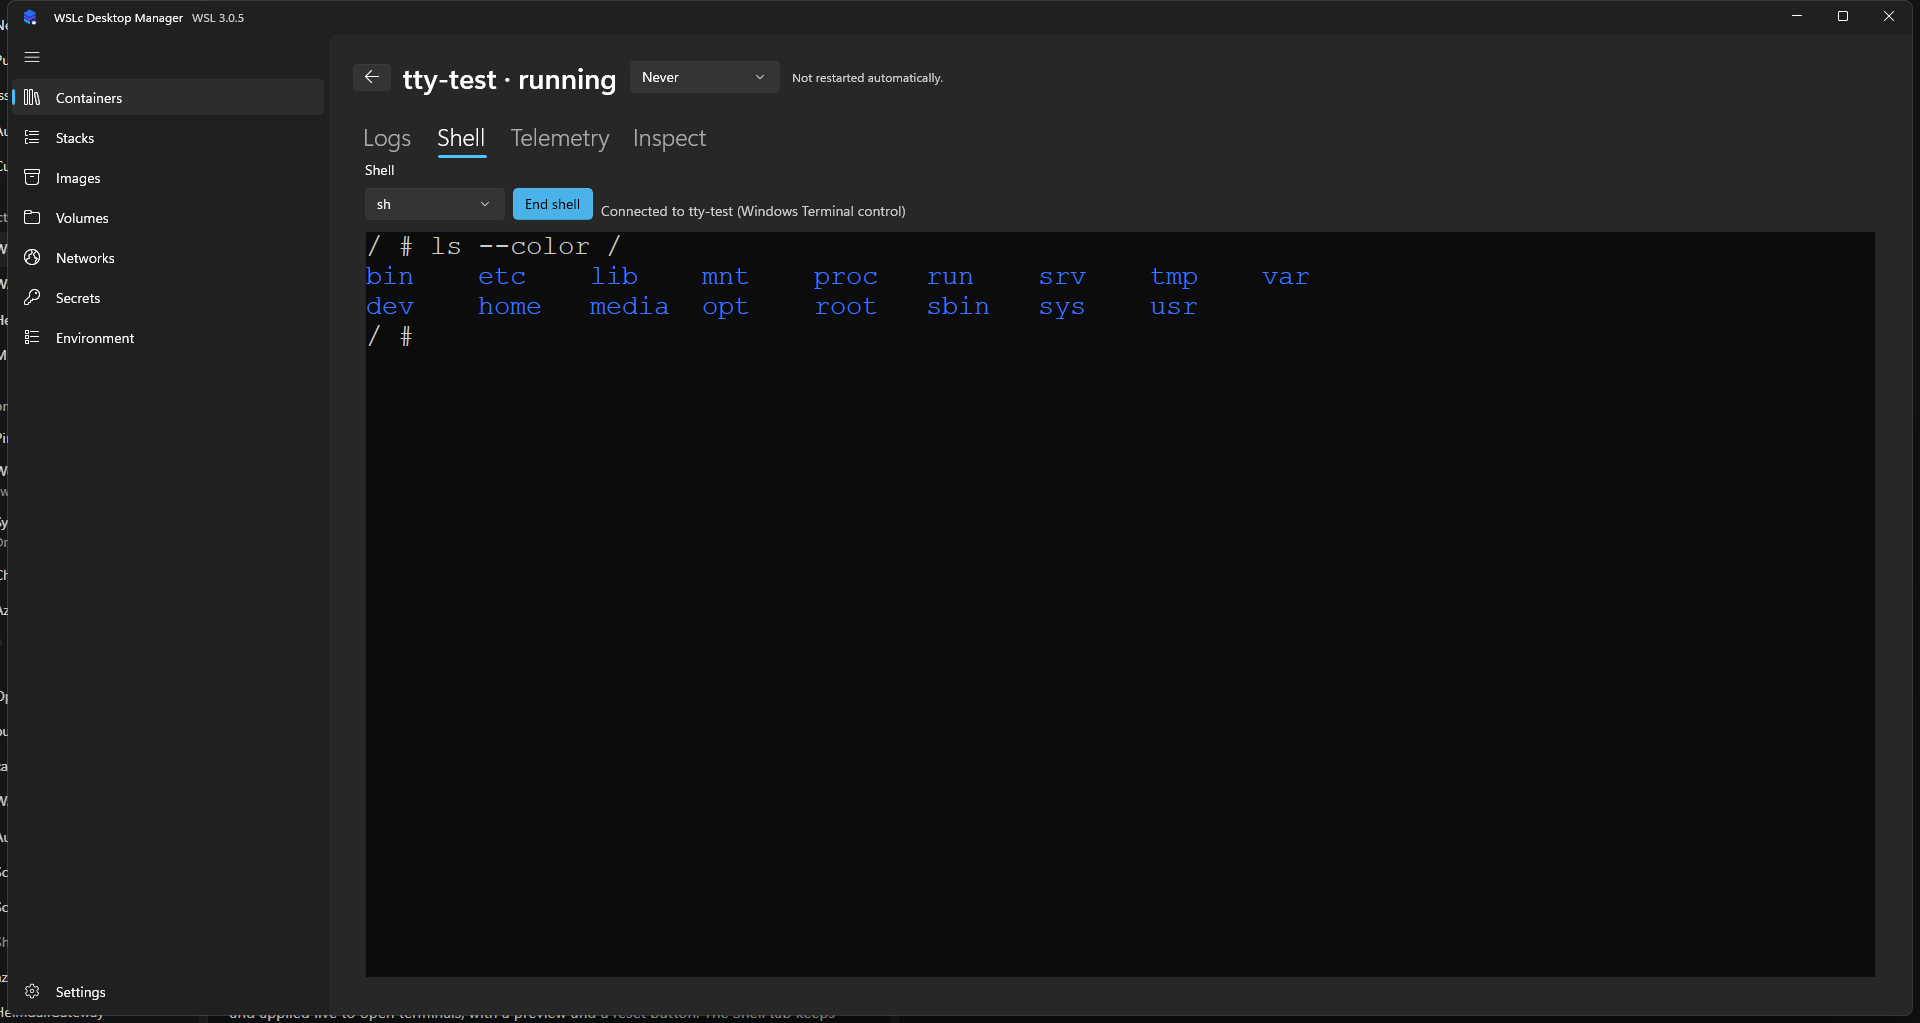
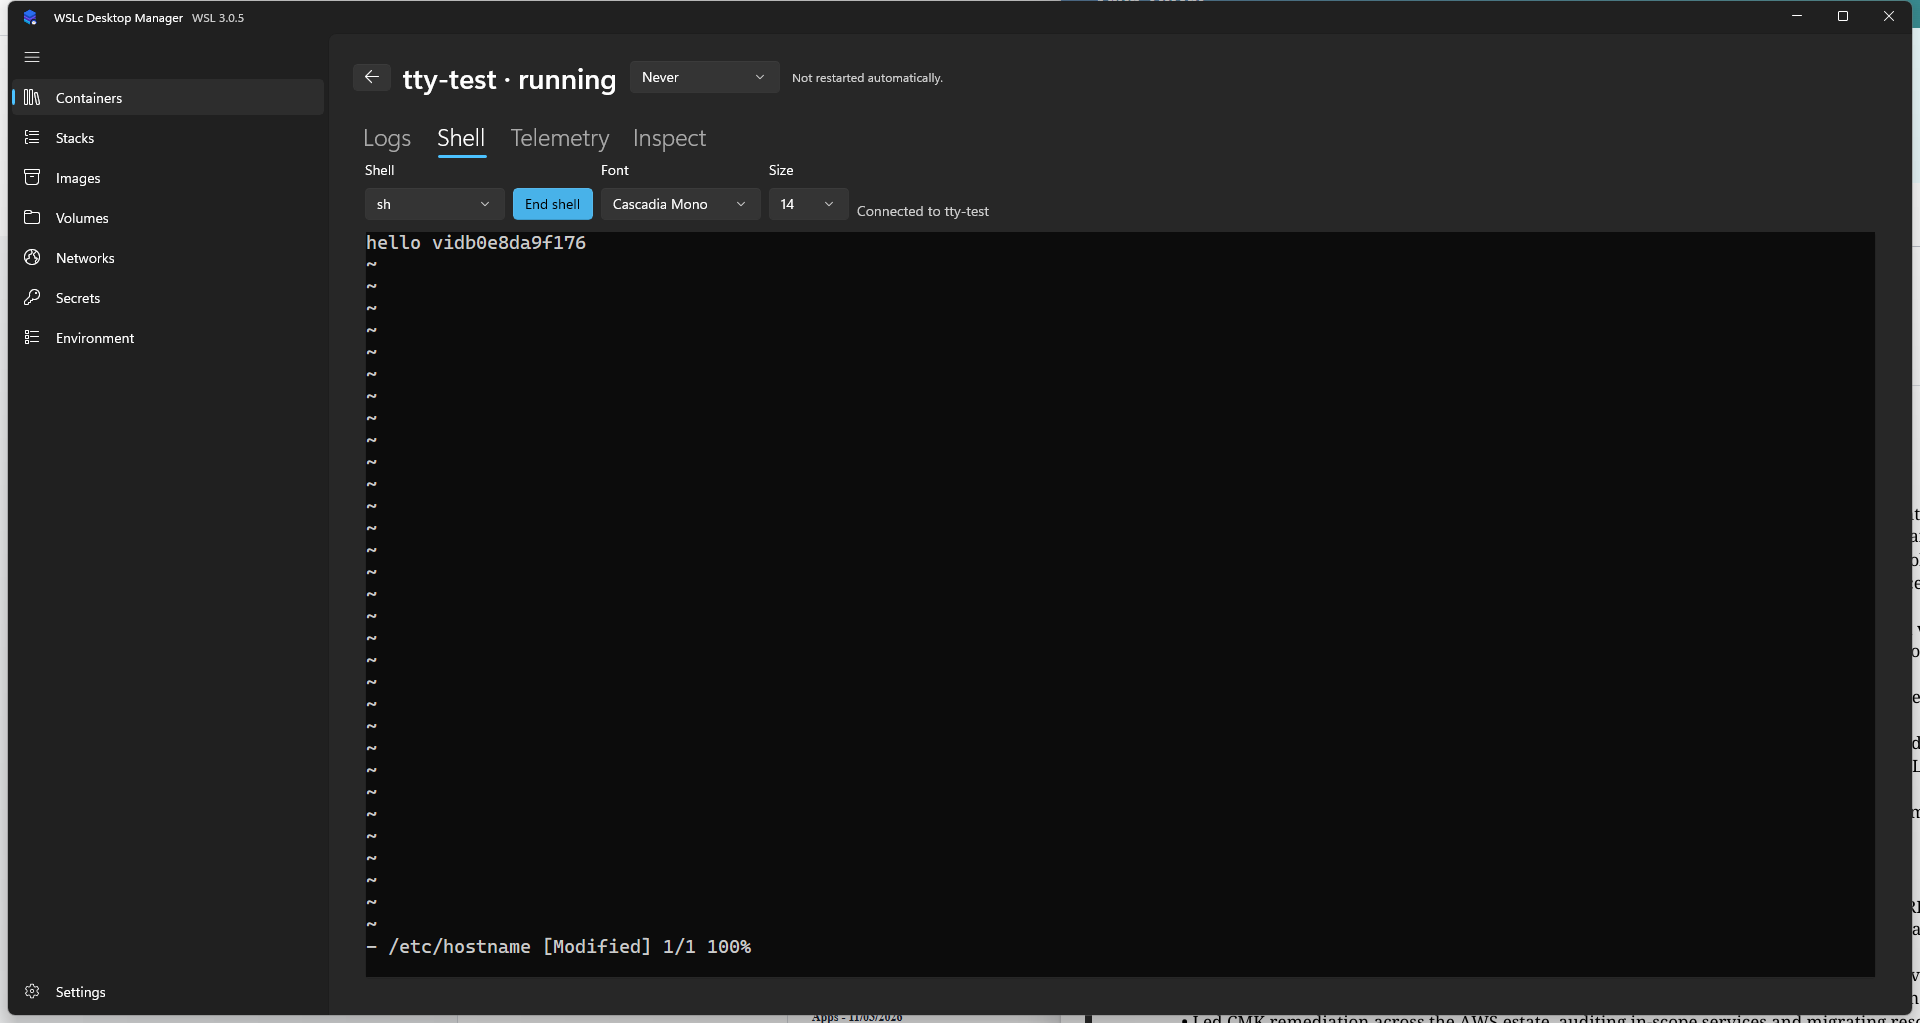
Pick a shell (such as sh), choose Start shell and type straight into the terminal. It's a real TTY: wslc exec --interactive --tty runs under a Windows pseudoconsole (ConPTY) and is parsed by a managed VT engine and drawn natively (Win2D) in the app, so colors, arrow, Tab and Ctrl keys, Ctrl+C, scrollback and full-screen programs such as vi, top and less work. The terminal resizes with the window and follows the app's light or dark theme.
- Copy and paste: select text to copy with Ctrl+Shift+C (or Ctrl+C while text is selected); paste with Ctrl+V, Ctrl+Shift+V or right-click.
- Font: set the terminal font and size under Settings > Terminal (see Settings). Changes apply to open terminals and are saved.
- Fallback: if the terminal can't start (for example the native terminal library is missing), the tab falls back to the simple line-based shell, which has no TTY.
- Secrets: the raw terminal stream isn't passed through secret redaction, so values you print in the shell are shown as-is.
Choose End shell when you're done. See the terminal decision for why this approach was chosen.
If the container is stopped, the tab offers Start container instead.
Telemetry
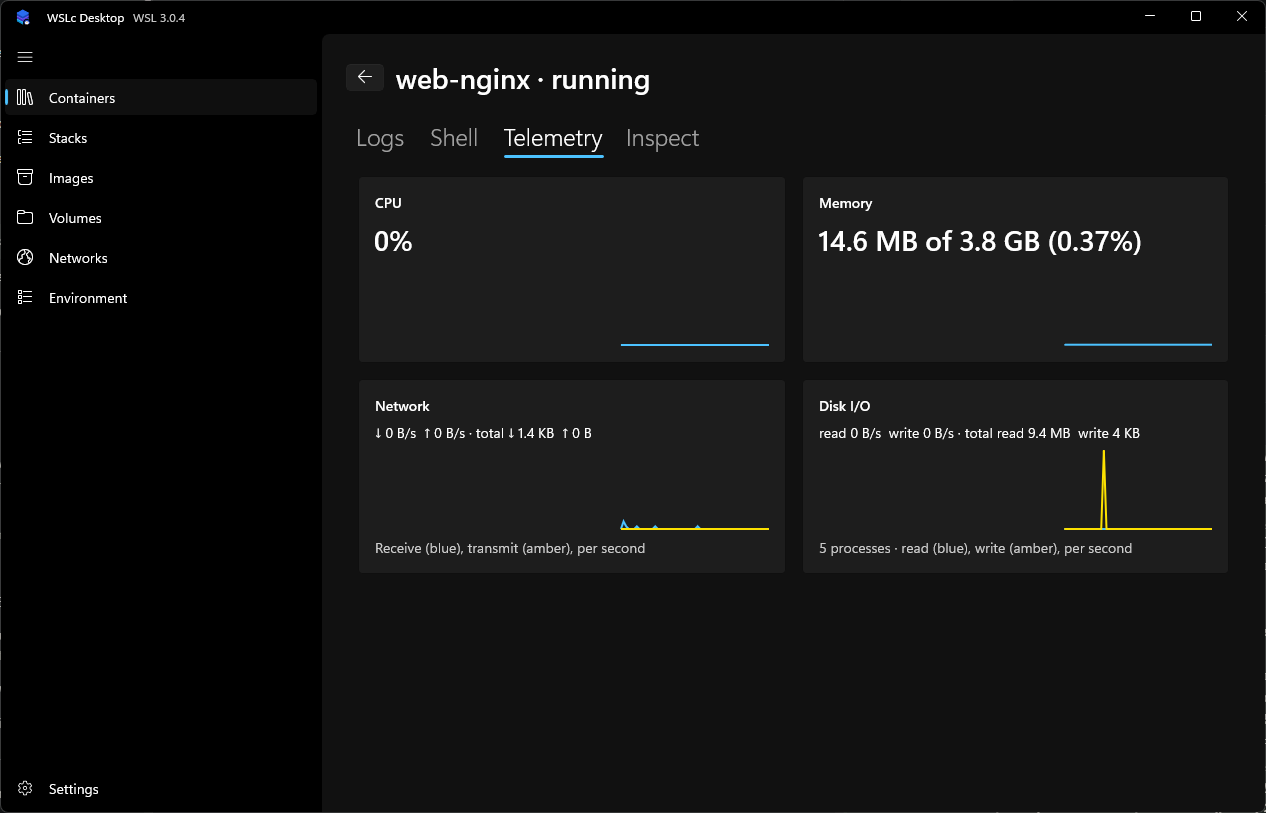
Live charts for CPU, Memory, Network (receive and transmit per second) and Disk I/O (read and write per second), plus process count and running totals.
Inspect
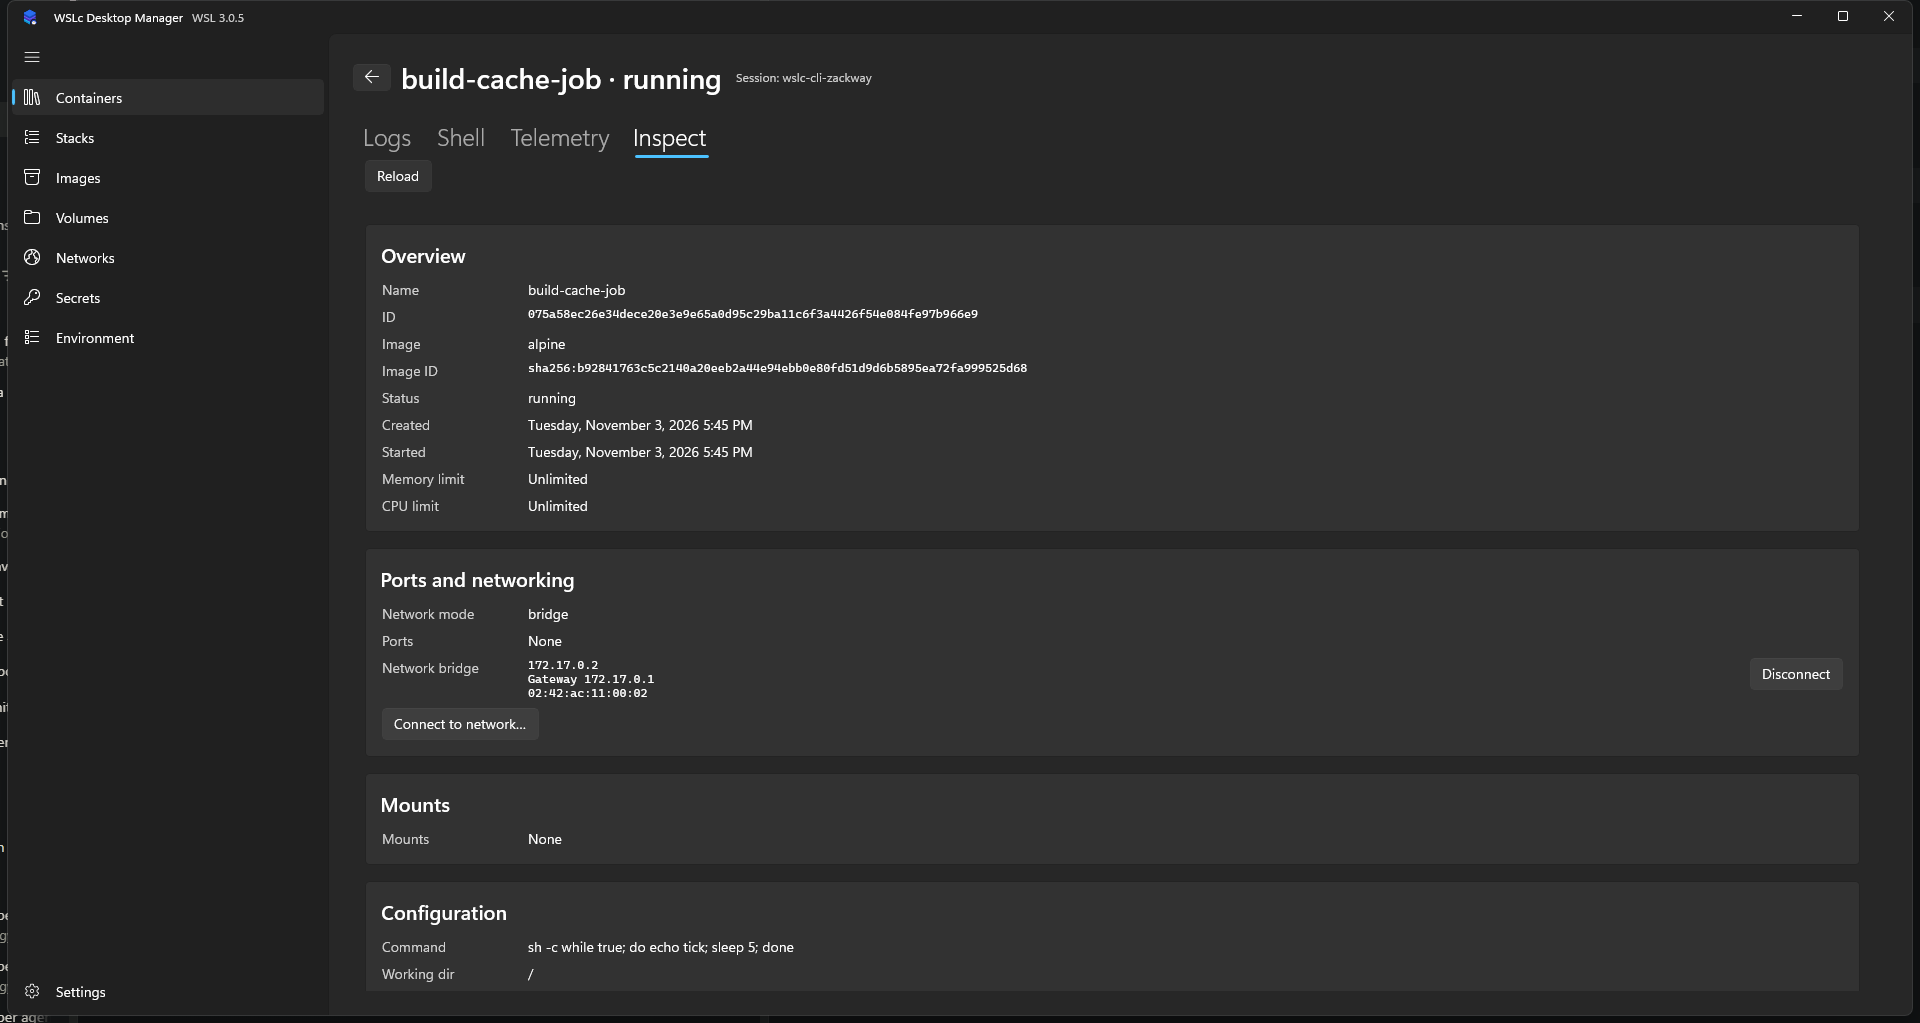
A structured view of the container: overview (ID, image, status, timestamps, limits), ports and networking, and more. Use Reload to refresh it. From the networking section you can Connect to network… or Disconnect a network. A Raw JSON expander shows the unprocessed inspect output.